

June, 2023 – They reveal calamities in forest stands and monitor how quickly it develops until rangers intervene. They identify places prone to the formation of ravines early, whether in forest undergrowth or in the open. They calculate actual erosion in fields and find the least labor-intensive to reduce it.
They monitor how crops grow and where irrigation or nutrition might be lacking. They map areas infested with toxic substances and model which way it’s spreading. They estimate the risk on roads, pipelines, railways, and even in industrial areas, especially with a large number of parameters incomprehensible to the human mind.
With the appropriate “translation” technology basically everything on the surface of the Earth is visible with a resolution of only a few centimeters, thanks to satellites with advanced sensors like multispectral, hyperspectral, and radar. No development remains hidden, it is possible to detect and measure most problematic phenomena in the country. Especially those, invisible to the naked eye, that develop gradually and can cause a lot of damage over time.
We need the research in practice
This is precisely the focus of the YMS software research laboratory. For several years we have been partners with the European space agency and a certified laboratory authorized by the Ministry of Education to compete for leadership or participation in European projects. We work on projects that take freely available raw satellite data and using expert procedures prepare processed and comprehensible outputs for various groups of experts.
These demanding applications are created in cooperation between professional partners thanks to European research projects and take thousands of hours of scientific analysis, software architecture, and programming. “The research objective is nothing less than protecting the Earth with technology. We do this by obtaining/acquiring, cleaning, analyzing and “translating” the data into an understandable form for experts who have an in-depth understanding of the observed phenomena. In forestry, in agriculture, in industrial areas, and on line constructions, they can use them for changes in management or administration, solving problems before they arise and lowering the probability of negative impacts that cannot be eliminated,” says the director of research and innovation projects of YMS, Radovan Sunega.
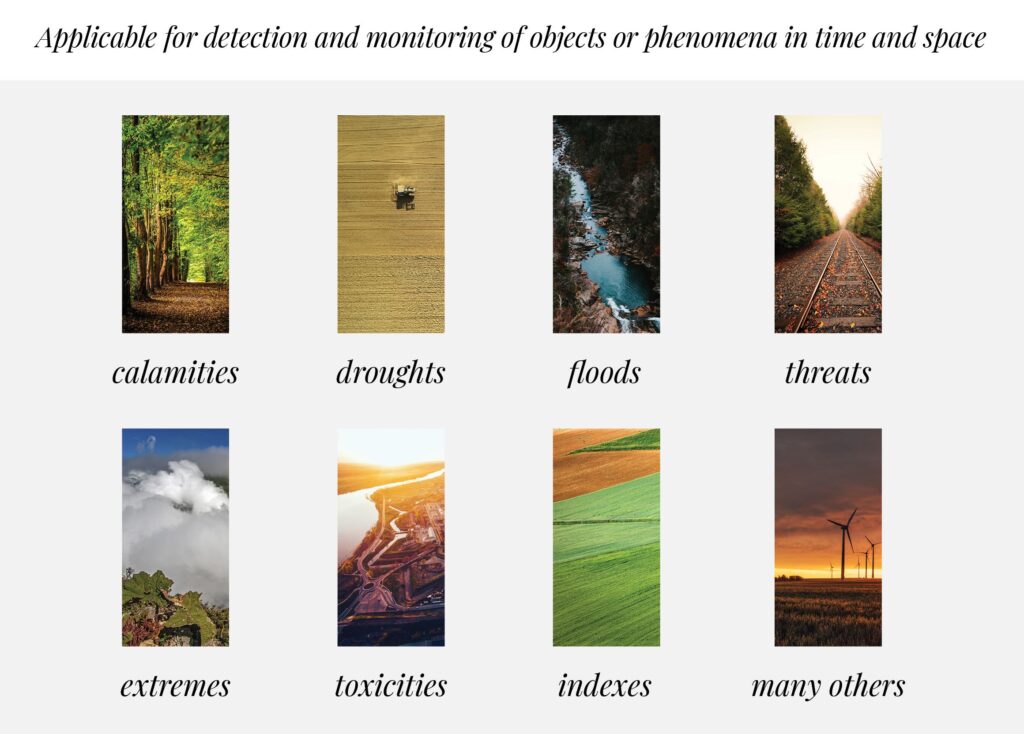 Figure 1: Today, satellites can uncover nearly all negative phenomena on the surface of the Earth. Processed data can shed light on past and current events, and predict the future while monitoring many parameters at once and over vast territories.
 The trick is in the correct translation
YMS has earned the trust of the European Space Agency (ESA) as a highly technologically capable partner. “Our team is working on the second task in a row. We started with monitoring calamities in forests and moved to agricultural land, where we are currently evaluating the fertility of Slovak fields” says Radovan Hilbert, an expert in satellite technology and director of business development at YMS.
The space translator, known as ySpace, became the innovation of the year, awarded by the Minister of Economy. “We have to translate the data in such a way that the end user can use it, otherwise they won’t accept it. And that is a great pity because through satellites we can already see everything, nothing is hidden. That is why we make applications focused on users. The technologies are wrapped up inside the application and the client doesn’t come into contact with them at all. They can, of course, transparently find the steps the system uses. In day-to-day use, however, they only get an interpreted result,” continues Radovan Hilbert.
Figure 2: Graphical representation of the occurrence of bark beetles in the geographical information system, identified from satellite data.
Suitable for operation and supervision
In operations and management, literal “aha” moments can occur. “We see large areas and compare several parameters at once, which would be very difficult to do without a satellite. Of particular interest is data outside the visible spectrum, such as infrared and thermal. From them, we can read the health status of trees and crops, infestation or damage by pests, soil moisture, or, the other way around, the effects of drought with an accuracy of a few meters. With the erosion calculator, we can even model the effects of anti-erosion measures that reduce soil degradation for farmers. We can retrospectively evaluate the production of various agricultural crops in a specific area, and compare fields not only across space but also across time.” Radovan Hilbert explains further.
Control authorities also benefit from translated data. “Nothing can really be hidden from a satellite, and now that we have images of all of Slovakia available for free every five to seven days, we can check a lot. However, a word of warning is necessary here, because an incorrect translation can lead to wrong conclusions, which can sometimes do even more damage,” continues Radovan Hilbert.
Figure 3: Agro Report: graphical representation of leaf greenness and water index as they evolve over time and comparison with a similar plot.
A walk through an industrial area in virtual reality
In the spatial monitoring project, we also investigated the use of game software in an unconventional way. We modeled a real industrial area in virtual reality for the purpose of visual monitoring of selected parameters. “It’s not about simple data such as what is located where, what material is it made of or what color, which we already know from virtual models. It’s about spatial data, such as temperature, pressure or air humidity, measured by sensors, refined with software tools, and converted into visual form. Phenomena and values that we don’t see around us even in the real world,” says Ivan Ilavský, YMS software architect and one of the project’s main solvers, explaining the complex issue of visualizing invisible phenomena in space.
Figure 4: Visualization of invisible parameters like temperature, pressure, and humidity in the air in a 3D model in a geographical information system
Spatial monitoring in this case means the “visibility” of phenomena on the users’ screens. The potential for this is huge. “It can be an industrial site, where sensors measure and software processes and visualizes hazardous substances in the air or the temperature around equipment. So that the safety of people and the area is ensured and that warnings about a possible threat come in time. For example, the leakage of harmful substances, that can cause contamination or harm an employee. Or equipment overheating above the operating temperature limit as the first indicator of an impending malfunction or crash. We can not only discretely measure the data, but also calculate the clouds, using interpolation, appropriately chosen on the basis of the directional gradients of the values,” continues Ivan Ilavský with concrete examples.
Technological superheroes
Every advancement in research isn’t only due to the breakneck advancing technologies. Success or failure depends mainly on our team, skilled and experienced specialists in analysis, software architecture, and programming. They are willing to constantly learn, advance professionally, discuss with users and managers on the client’s side and use their talents for our benefit.
“Our informational comfort is based on complex thinking. They infer the client’s needs in advance, get involved in their issues, and carefully consider each step in the system so that there is no need to hesitate for a moment on where to click. IT specialists of all fields are superheroes of the technological world. Hidden from the eyes of the end user, but still connected to them with every click. I’m glad that YMS has a team that does this every day not only professionally, but also with commitment and humanity,” concludes Róbert Franček, the new executive director of YMS, who is taking over the management of the company from the hands of Mikuláš Szapu’s family after 30 years.